December 31, 2025
It is clear that there has been global warming since early 1970's. And 2024 was record. And from January to May tempararure has been near 2024
level (February was cold), but from June to December temperature has been lower than 2024, so year 2025 will be third warmest (it would not be
surprise if NASA declares that 2025 will be second warmest).
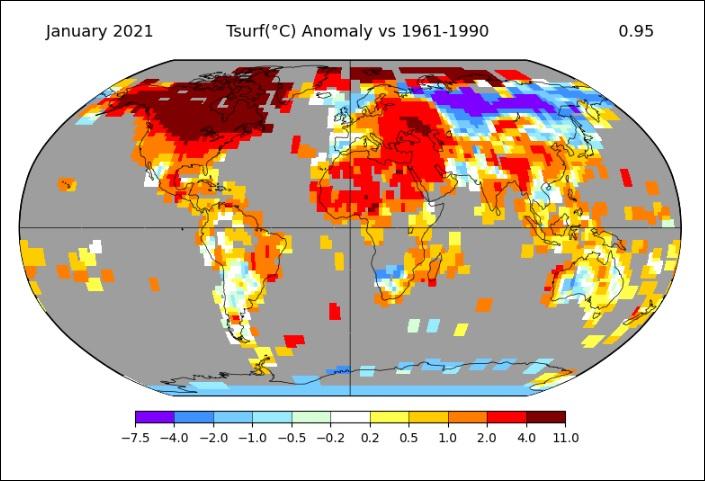
2025 began very warm but it ended colder. In some places there has been warm: Iceland +19.6°C and there has been warm in Middle East, too. But Canada has been cold, parts on Russia, too, and South Africa.
NASA has had retutation of altering global temperatures, Other agencies have done this, too, but NASA is worst. When Met Office (UK) makes new calculations (HadCrut3, HadCrut4, and Hadcrut5, 2005 and 2007 are significantly warmer, but year 1944, too. Whan NASA makes "updates", 2005 and 2007 bill become warmer (like Met Offive) but 1920's and 1930's becomes colder.
NASA is trying to hide this Climate Scam, so it is a complicated process to dig it out.
Past "Corrections"
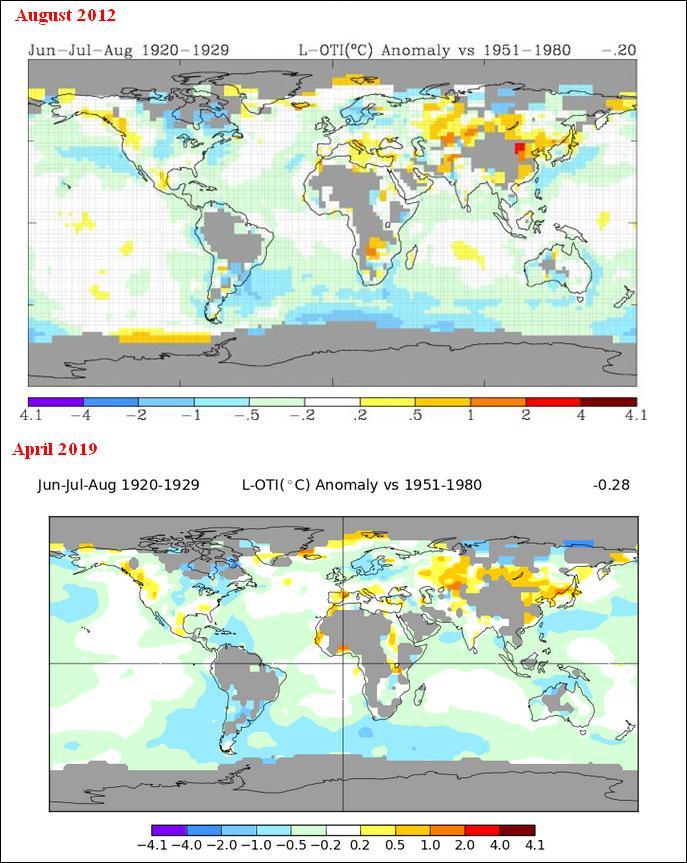
Temperatures for 1920-1929 (first picture from the year 2012, second 2019).
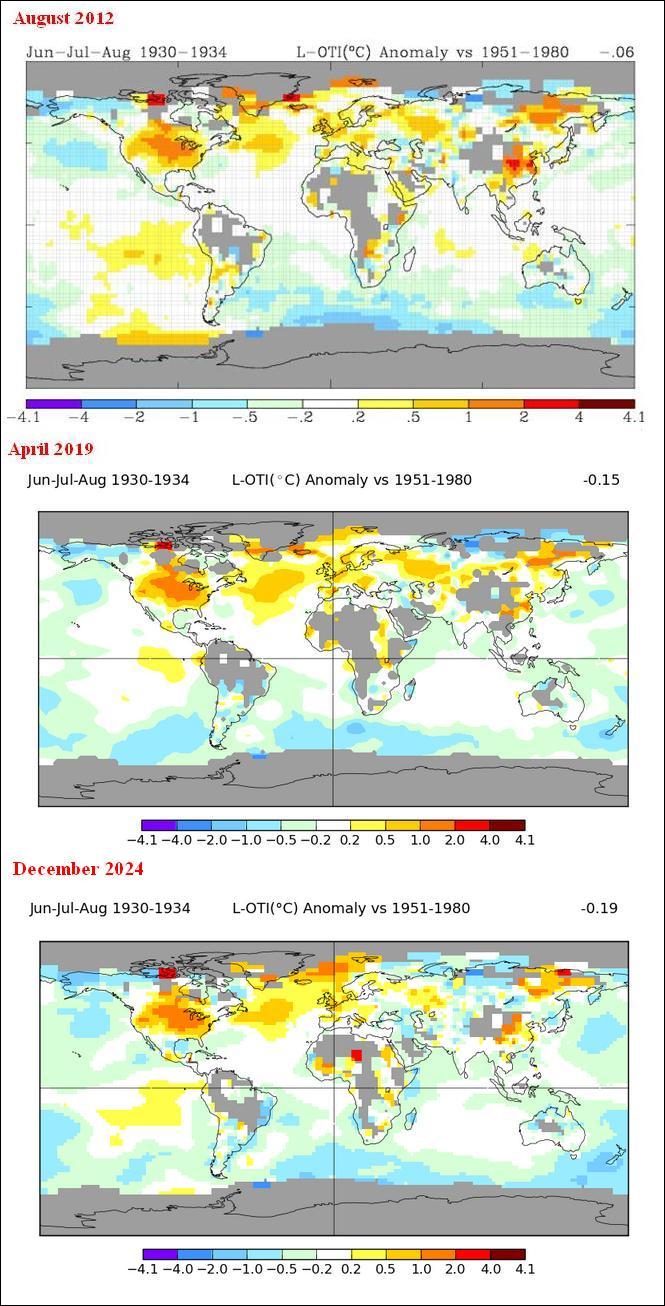
Temperatures for 1930-1934 (first picture from the year 2012, second 2019, thirs 2024).
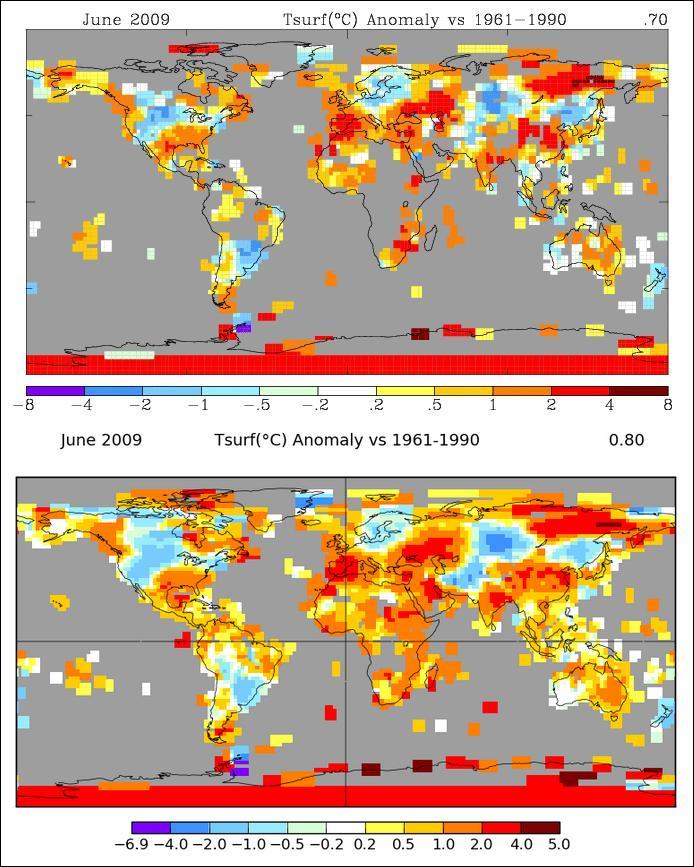
June 2009 - less blank, temperature rises.
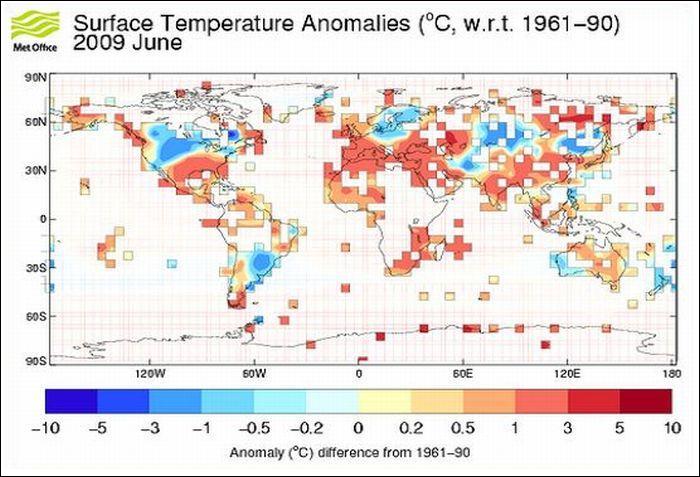
And for comparison Met Office (CRUTEM3)- sama month.
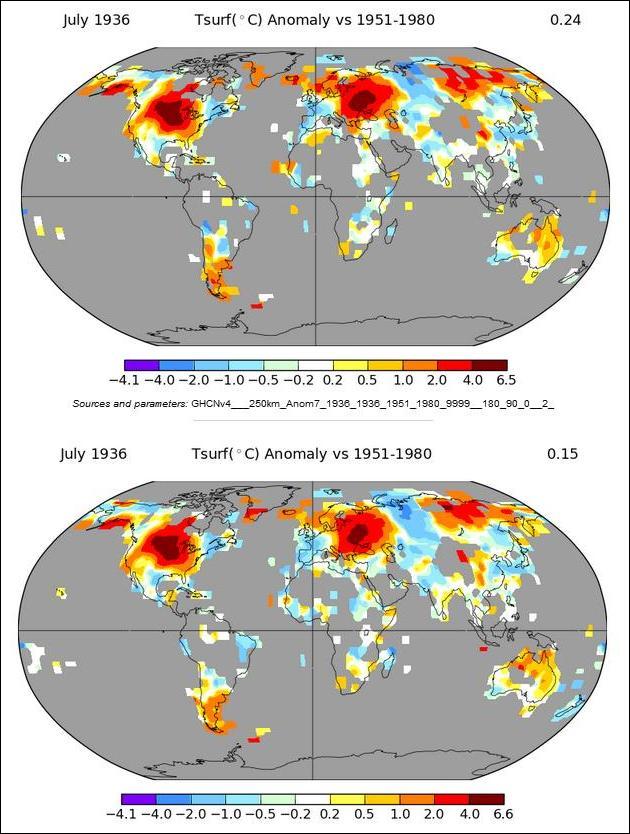
July 1936 - Land Only.
For some reason NASA did not "update" USA temperatures down. Maybe they did it earlier. Met Office (CRUTEM5) says the figure is +0.26°C (Base Period 1961-1990). In this NASA map, Base period is 1951-1980, so 1961-1990 is about 0.10°C lower. And NASA "removes" UHI (Urban heat Island, while NOAA, Met Office or JMA do not). tee.
March 2019 - Land Only.
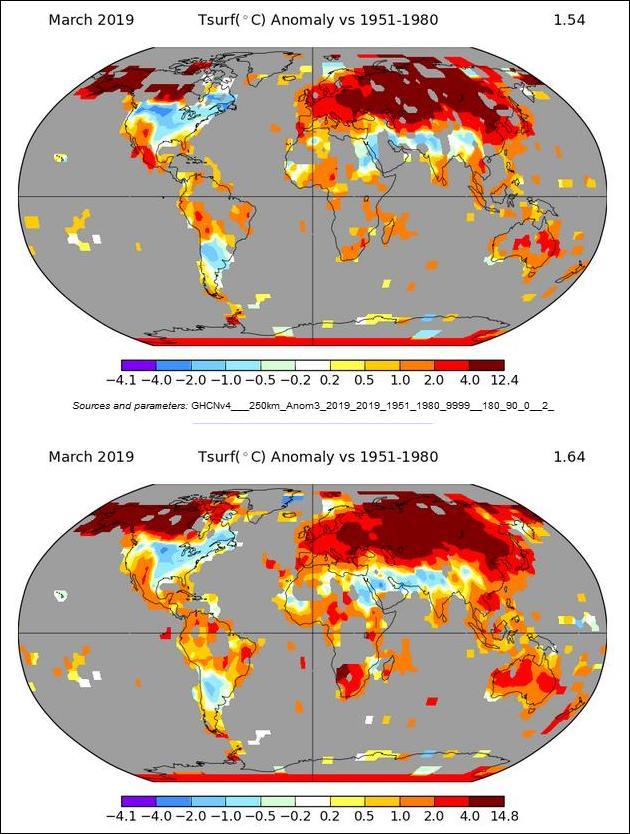
First picture from the year 2012, second 2019.
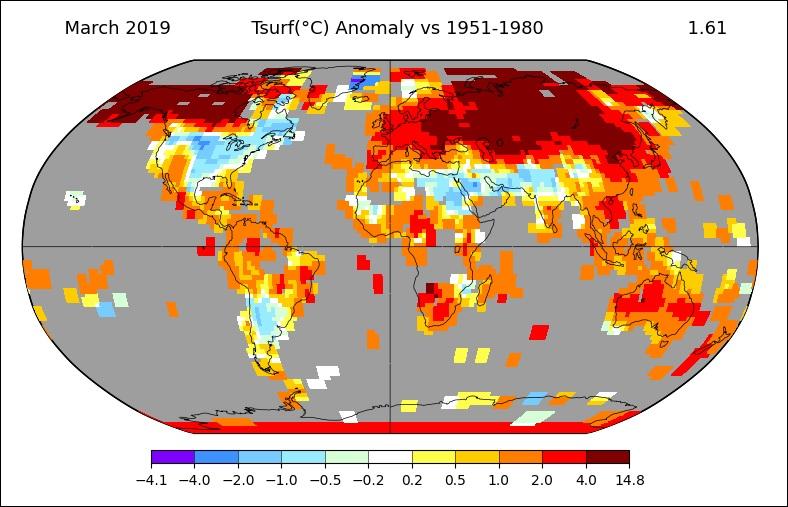
And this is fresh picture a bit colder - but this is Land Only.
According to Met Office (CRUTEM5), it is +1.54°C. If we translate thet figure to 1951-1980 Base Period, it will be +1.735°C. For 2019, Met Office gives significantly higher figure. So, NASA claim that she "reduces" UHI has some validity.
This is pretty absurd.
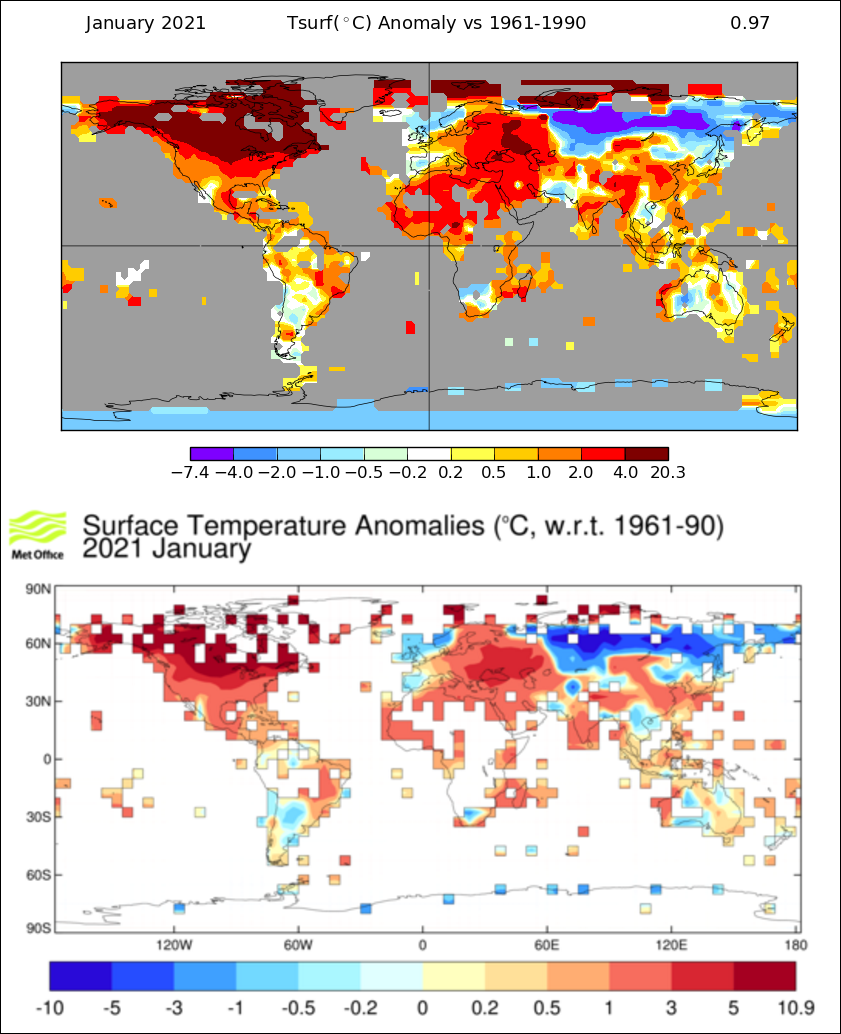
Fresh picture.
Later NASA removed this +20.3°C from Northern Canada. NASA removes UHI from some locations, fore example Las Vegas and Phoenix, but also from Alaska and Canadian Arctic. Land Only temperature was a little down at the same time.
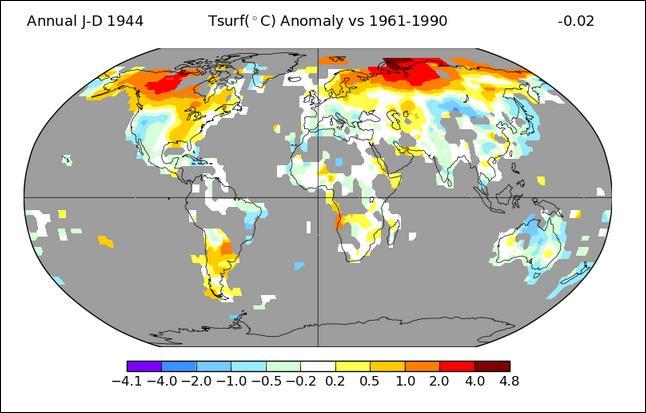
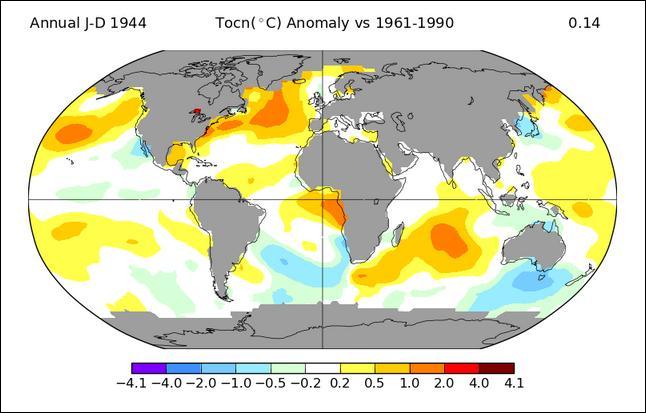
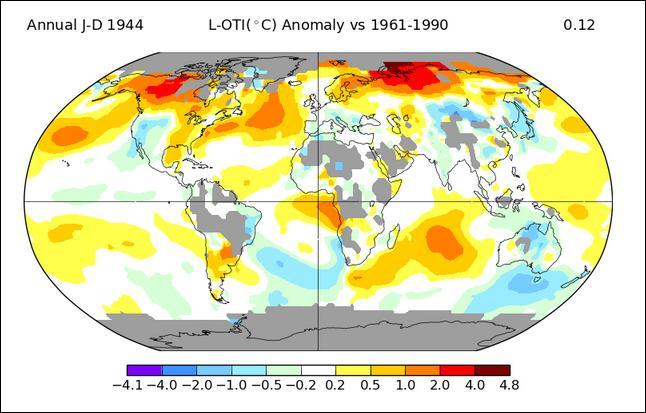
Twisted math. 1944 Land only is negative 0.02°C. According to Met Office, it is positive 0.084°C.
More Twisted Math
This is the most absurd thing NASA has published. Temperature change from October 2025 to November 2025.
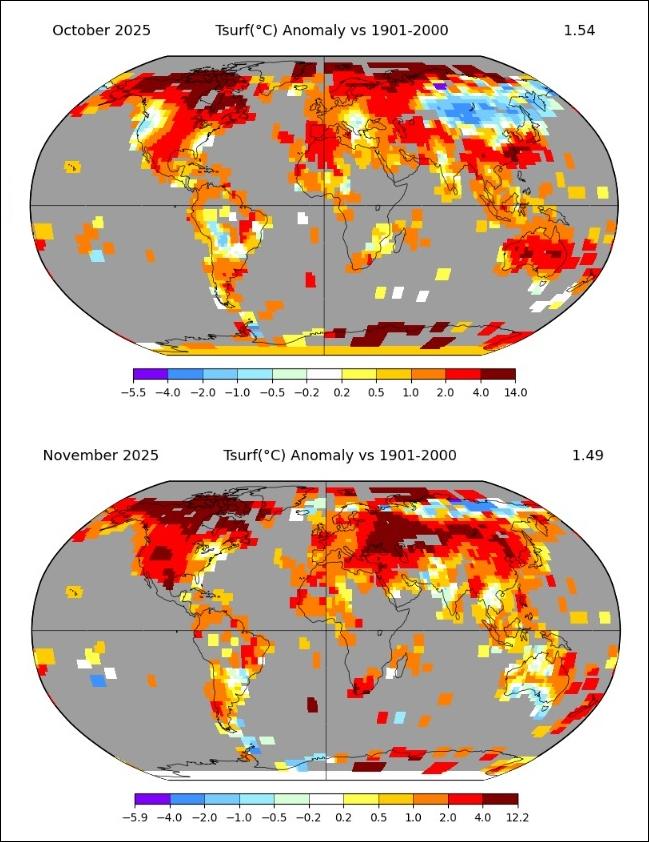
Land Only - down from +1.54°C to +1.49°C.
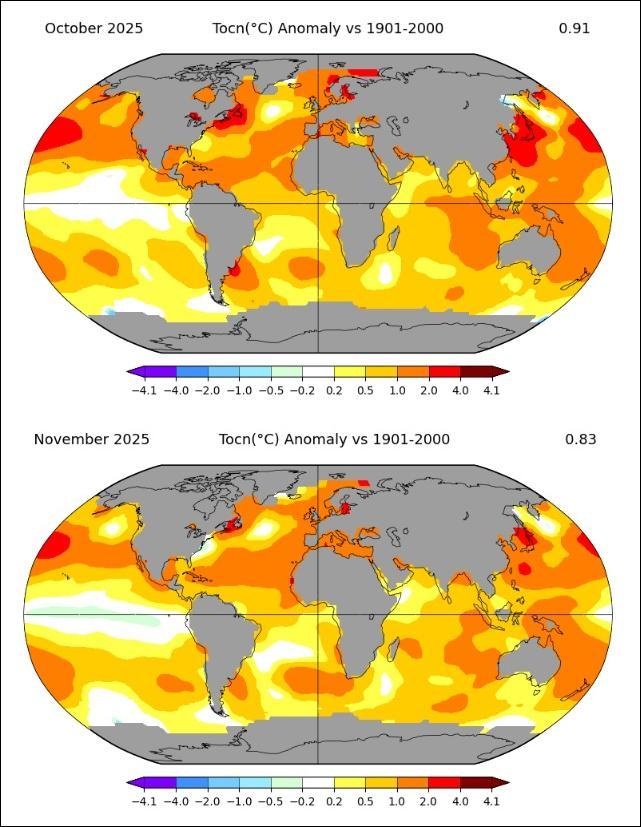
Ocean Only - down from +0.91°C to +0.83°C.
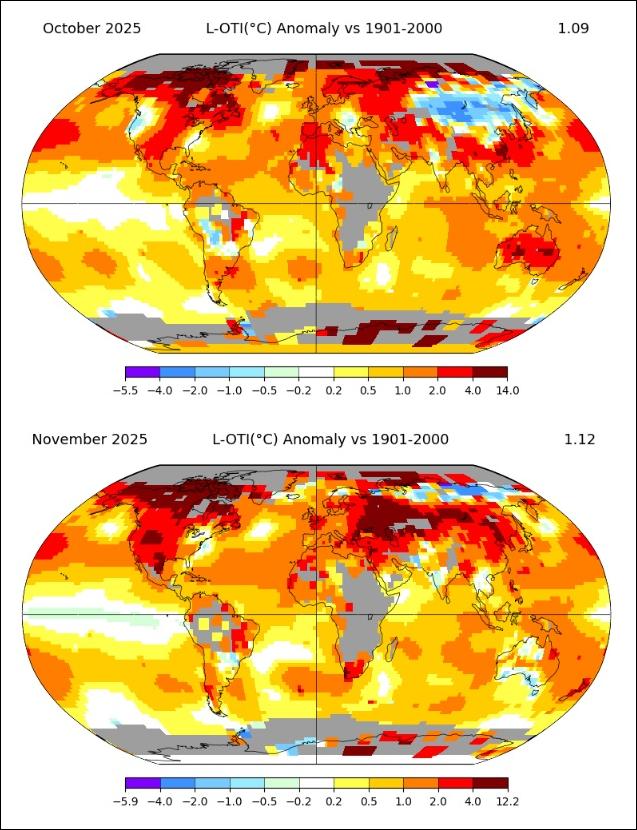
Land + Ocean (Radius 250 km) - up from +1.09°C to +1.12°C.
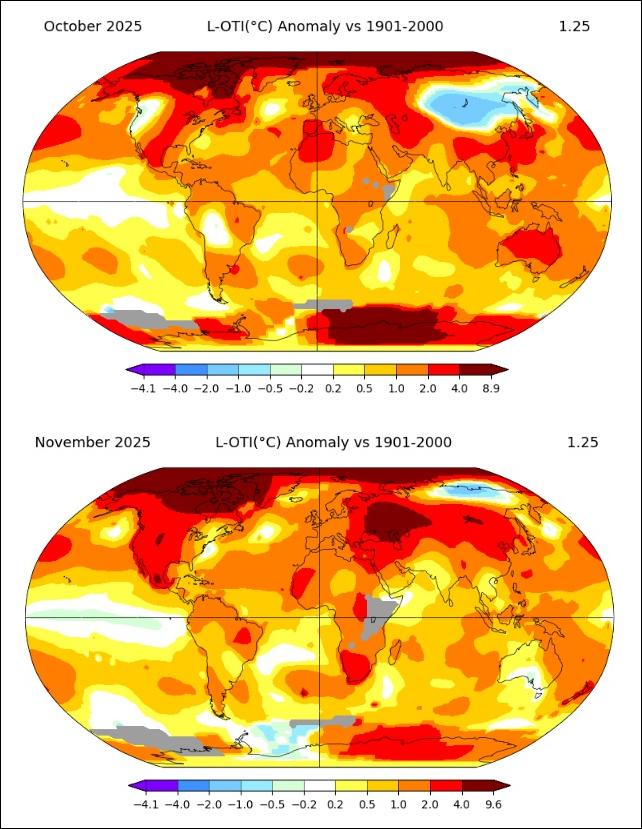
Land + Ocean (Radius 1,200 km) - unchanged +1.25°C.
For November, Land-Ocean ratio os 0.44/0.56. In 1,200 km version, it is well over 50 % for Land. For real, Ocean covers about 70 % of Earth's surface, Land rest 30 %. For October, ratio is totally different, much closer to the reality. This is the only reason for this absurd map.
Data From the Year 2010
Land + Ocean temperatures - taken in 2010.
Base Period 1951-1980, radius 1,200 km. Later NASA stopped publishing this type on table data. Check the year 2007.
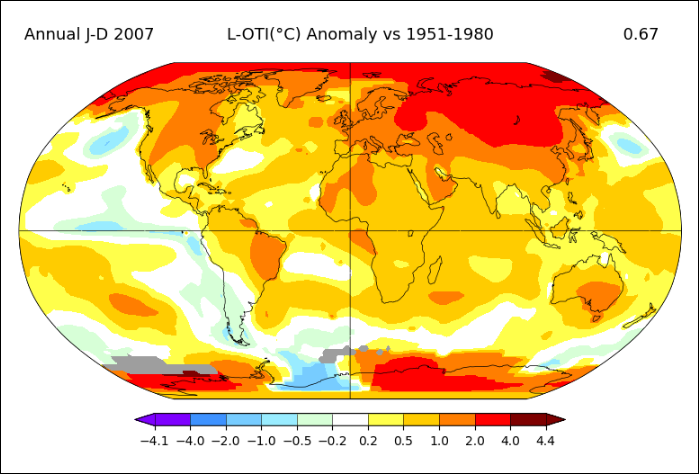
Fresh picture - year 2007 is now significantly warmer.